A friend of mine recently drove cross-country and came back absolutely baffled. He had a brand-new hybrid SUV with a sticker claiming 42 MPG combined, but his road-trip average came out closer to 29 MPG. He called me halfway through New Mexico, half-joking that the manufacturer had lied to him. Sound familiar? The gap between what’s printed on the window sticker and what actually happens when rubber meets road is one of the most persistent frustrations in car ownership — and in 2026, with fuel prices still bouncing unpredictably, that gap costs real money.
Let me walk you through what I’ve learned after years of tracking every fill-up, digging into EPA test methodology, and comparing real-world owner data. No lectures — just the math and the context you actually need.
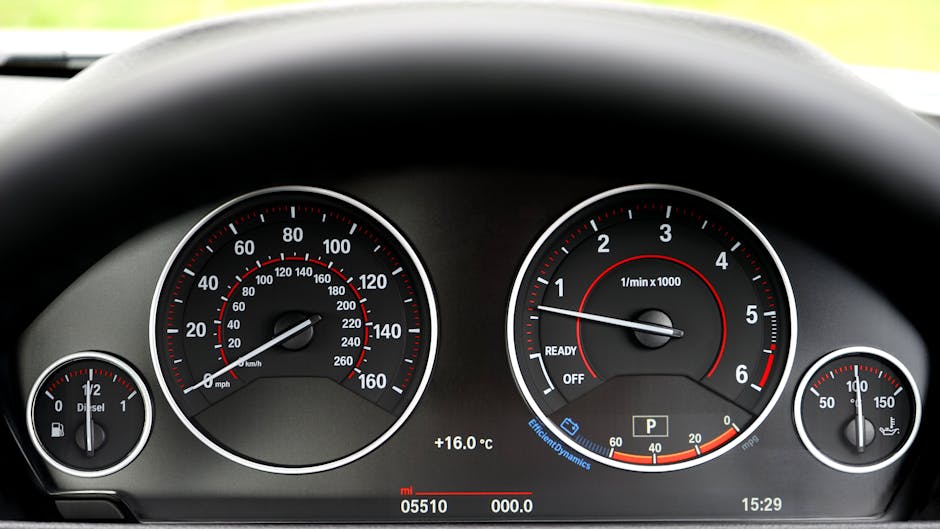
Why the Sticker Number Is Almost Always Wrong
The EPA’s current five-cycle test — which includes city, highway, high-speed, air conditioning, and cold temperature cycles — is genuinely more realistic than the old two-cycle method retired back in 2008. But it still runs on a dynamometer in a climate-controlled lab. Your commute does not happen in a climate-controlled lab.
Here’s the core problem in plain numbers: EPA testing uses a standardized “reference fuel” with precisely controlled energy content. Real pump gasoline, especially E10 blends (the 10% ethanol mix that’s standard across most of North America), delivers roughly 3–4% less energy per gallon than the reference fuel. That alone shaves 1–2 MPG off a car rated at 35 MPG before you’ve even left the driveway.
Stack on top of that:
- Cold starts: Engine efficiency drops sharply below 40°F (4°C). A gasoline engine doesn’t reach peak thermal efficiency until coolant temperature hits roughly 195°F. Short trips under 5 miles may never fully warm up, tanking city MPG by 15–20%.
- Tire pressure: Each 10 PSI underinflation costs approximately 0.5–1% fuel economy. It sounds trivial until you realize the average vehicle on U.S. roads is running 6–8 PSI low (NHTSA data, consistently replicated in AAA studies).
- Roof racks and cargo boxes: An empty cargo box at highway speeds can reduce MPG by 6–17% depending on shape and speed — numbers confirmed by both SAE testing and Consumer Reports real-world evaluations.
- Speed: Aerodynamic drag scales with the square of velocity. Going from 65 MPH to 80 MPH doesn’t increase drag by 23% — it nearly doubles it. For a typical sedan, that jump alone can cut highway economy from 38 MPG down to 30 MPG.
- AC load: A full compressor load on a hot day pulls 5–7% of total engine output on most 4-cylinder engines. In stop-and-go traffic, that easily means 2–4 MPG lost.
The Real Numbers: Owner Data vs. EPA Ratings
The best large-scale source of real-world fuel economy in North America is fueleconomy.gov’s “Your MPG” database, which aggregates self-reported fill-up data from hundreds of thousands of owners. It’s imperfect (self-reported data has bias), but the trends are consistent and valuable.
Here’s a snapshot of how popular models have been performing in real-world owner reports versus their EPA combined rating:
- Toyota RAV4 Hybrid AWD — EPA: 40 MPG combined. Owner average: ~36–37 MPG. Delta: –8 to –10%.
- Honda Accord 1.5T — EPA: 33 MPG combined. Owner average: ~31–32 MPG. Delta: –3 to –6%.
- Ford F-150 3.5L EcoBoost — EPA: 20 MPG combined. Owner average: ~17–18 MPG (with typical payload and trailer use). Delta: –10 to –15%.
- Tesla Model 3 Long Range RWD — EPA equivalent: 132 MPGe. Real-world range typically runs 10–15% below EPA in winter conditions due to battery heating loads.
- Toyota Corolla Hybrid — One of the closest to sticker in owner reports. Real-world average: ~47–49 MPG vs. EPA 52 MPG combined. Delta: –6 to –10%.
The pattern holds across categories: expect a 5–15% real-world shortfall from the EPA combined number under normal mixed driving. Aggressive drivers, cold climates, or heavy haulers will see the high end of that range.
How to Calculate Your Actual Fuel Cost (The Method That Works)
Here’s the simple formula I use, and I wish someone had handed it to me ten years ago:
Annual fuel cost = (Annual miles ÷ Real-world MPG) × Average price per gallon
Let’s say you drive 15,000 miles per year, your car actually gets 30 MPG in mixed driving (not the sticker 36 MPG), and you’re paying $3.50/gallon:
15,000 ÷ 30 × $3.50 = $1,750/year
Now run it with the sticker number: 15,000 ÷ 36 × $3.50 = $1,458/year. That’s a $292 annual difference just from overestimating MPG. Over five years of ownership, you’ve mentally budgeted $1,460 less than you’ll actually spend. On a vehicle decision worth $35,000+, that math matters.
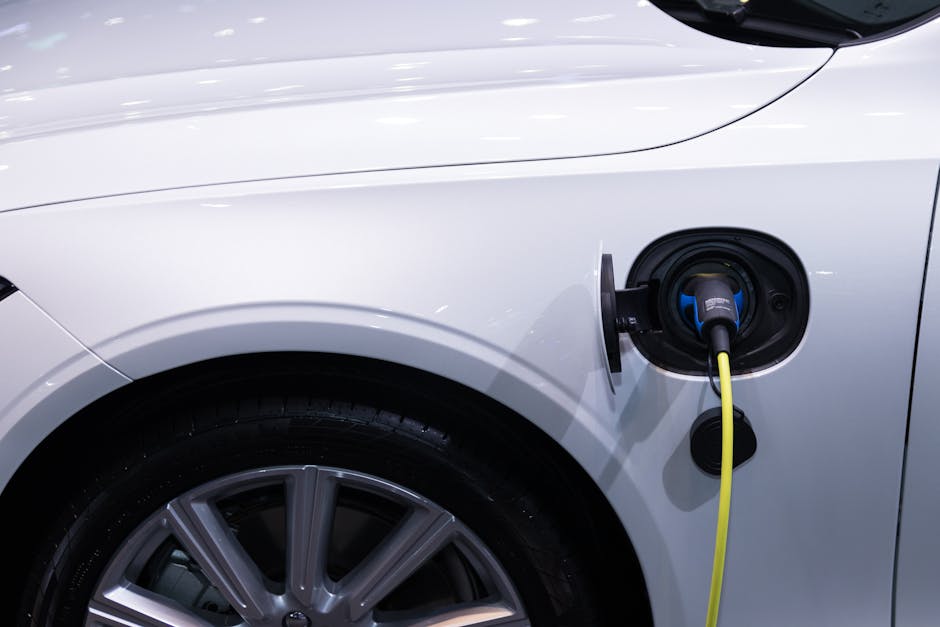
Plug-In Hybrids: The Math Gets Trickier
PHEVs (plug-in hybrids) introduce a new wrinkle. Their EPA ratings are calculated assuming a blend of electric and gasoline miles that may not reflect your real driving pattern. The Toyota RAV4 Prime, for example, has a combined EPA rating of 94 MPGe. But if you never plug it in — driving it purely as a conventional hybrid — you’ll see around 37–40 MPG. If you charge daily and most of your trips fall within its ~42-mile electric range, your “effective MPG” could be well over 100 MPGe.
The honest conclusion: PHEV fuel economy numbers are basically meaningless without knowing your specific daily mileage and charging habits. I’d always recommend running both scenarios — “always charged” and “never charged” — when budgeting for a PHEV purchase.
Five Habits That Actually Move the Needle
Forget the hypermiling extremes. These are the practical changes with measurable payoff:
- Check tire pressure monthly — Takes 5 minutes, costs nothing. Set to the door placard spec, not the tire sidewall max.
- Accelerate smoothly, not slowly — Contrary to popular belief, moderate brisk acceleration to highway speed is more efficient than excessively slow acceleration that keeps you at low gears longer. Get up to speed, then cruise.
- Use cruise control on highways — Maintaining a steady 65 MPH vs. driver-controlled 62–72 MPH variation can recover 3–5% fuel economy. Modern adaptive cruise is even better since it anticipates slow-downs.
- Remove roof cargo when not in use — Storing an empty rooftop box in the garage between ski trips is worth real money on every highway mile.
- Plan cold starts — Combining short errands into one trip after the engine is warm is significantly more efficient than five separate cold starts. This is where hybrid advantages are most pronounced.
When to Trust the Sticker — And When to Ignore It
EPA ratings are still useful as a comparative tool when shopping between vehicles. If Car A is rated 28 MPG combined and Car B is 35 MPG combined, Car B will almost certainly be more efficient in your hands too — even if both underperform their stickers by 10%. The relative ranking is meaningful. The absolute number is not.
For budgeting purposes, apply a conservative 10–12% real-world discount to the EPA combined rating unless you specifically drive a lot of highway miles in mild weather (in which case 5–7% is more realistic).
If you want genuinely accurate real-world data for a specific model before buying, fueleconomy.gov’s user data, Fuelly.com (which has detailed fill-up logs from thousands of owners per model), and Consumer Reports’ Annual Auto Survey are the three sources I trust most. Cross-referencing all three gives you a solid picture.
💬 If you’re tired of doing rough math at the pump, bookmark Fuelly.com and start logging your fill-ups — after just 3–4 tanks you’ll have your personal real-world average, and it’s one of the most clarifying numbers you’ll ever know about your vehicle.
📚 관련된 다른 글도 읽어 보세요
- Why I Almost Gave Up on Dividend Investing — Real Talk About Dividend Stocks in 2025
- Why I Stopped Trusting ‘Best Deals’ Lists — Real {year} Smart Shopping Guide
- Why I Almost Gave Up on NFTs — Then Found What Actually Works in 2025
태그: fuel economy, MPG real world, car ownership costs, EPA fuel rating, hybrid fuel efficiency, gas mileage tips, PHEV efficiency
Leave a Reply