A friend of mine — a small business owner who’d been grinding away at her blog for almost a year — called me up one afternoon completely frustrated. ‘I’ve been doing keyword research exactly like all the tutorials say,’ she told me, ‘and my traffic is basically zero.’ Sound familiar? I’ve heard this story more times than I can count, and honestly, I’ve lived it myself. The problem wasn’t that keyword research doesn’t work. The problem was that most people are doing it the way it was taught in 2019, not the way search engines actually behave right now.
Let’s dig into what’s actually changed, what still works, and how to build a keyword strategy that doesn’t feel like you’re shouting into the void.
The Fundamental Shift: Keywords Are Now Concepts, Not Phrases
Here’s the uncomfortable truth: Google’s understanding of language has evolved dramatically. With the rollout of systems like MUM (Multitask Unified Model) and the continued refinement of BERT, Google no longer matches your page to a search query word-for-word. It’s matching intent. This means that stuffing your page with a target keyword 20 times is not just useless — it’s actively hurting you.
What does this mean practically? A page optimized around the concept of ‘how to reduce home energy bills in winter’ can rank for searches like ‘lowering heating costs,’ ‘affordable home warmth tips,’ and ‘cutting electricity expenses cold months’ — without ever using those exact phrases. The shift is from keyword density to topical authority.
A 2024 study by Semrush analyzing over 1.5 million SERPs found that pages ranking in the top 3 positions covered an average of 3.8x more related subtopics than pages ranking 11–20. That’s not a small gap. That’s a content philosophy difference.
The Three-Tier Keyword Framework That Actually Works
Rather than hunting for that one magic keyword, I’ve started thinking in three tiers — and this approach changed everything for the blogs and clients I work with.
- Tier 1 — Pillar Keywords: High volume, high competition, usually 1-2 words. Think ‘keyword research’ or ‘SEO strategy.’ You’re not going to rank for these quickly, but they anchor your content cluster. Target these with your longest, most comprehensive pages (2,000+ words).
- Tier 2 — Supporting Keywords: Mid-tail phrases, usually 3-5 words, with moderate search volume (500–5,000/month). These are your real workhorses. ‘Keyword research tools for beginners’ or ‘how to do keyword research free’ are examples. Aim for dedicated 800–1,200 word posts.
- Tier 3 — Long-Tail & Question Keywords: Low volume (under 500/month), but incredibly specific intent. ‘What keyword difficulty score should I target as a new blog’ gets very few searches — but the person typing that is exactly your reader. Conversion rates on long-tail traffic are typically 2.5–3x higher than broad terms, according to Ahrefs’ internal data.
Tools Worth Your Time (And Money) in 2025
The keyword tool landscape has gotten more crowded, not less. Here’s an honest breakdown based on what I actually use week-to-week:
- Ahrefs: Still the gold standard for backlink data and keyword difficulty scoring. Their ‘Traffic Share by Pages’ feature is underrated for competitive analysis. Pricing starts around $99/month — not cheap, but worth it if SEO is central to your business.
- Semrush: Better for content gap analysis and PPC-adjacent keyword research. If you’re running ads alongside organic, the overlap data alone justifies the subscription.
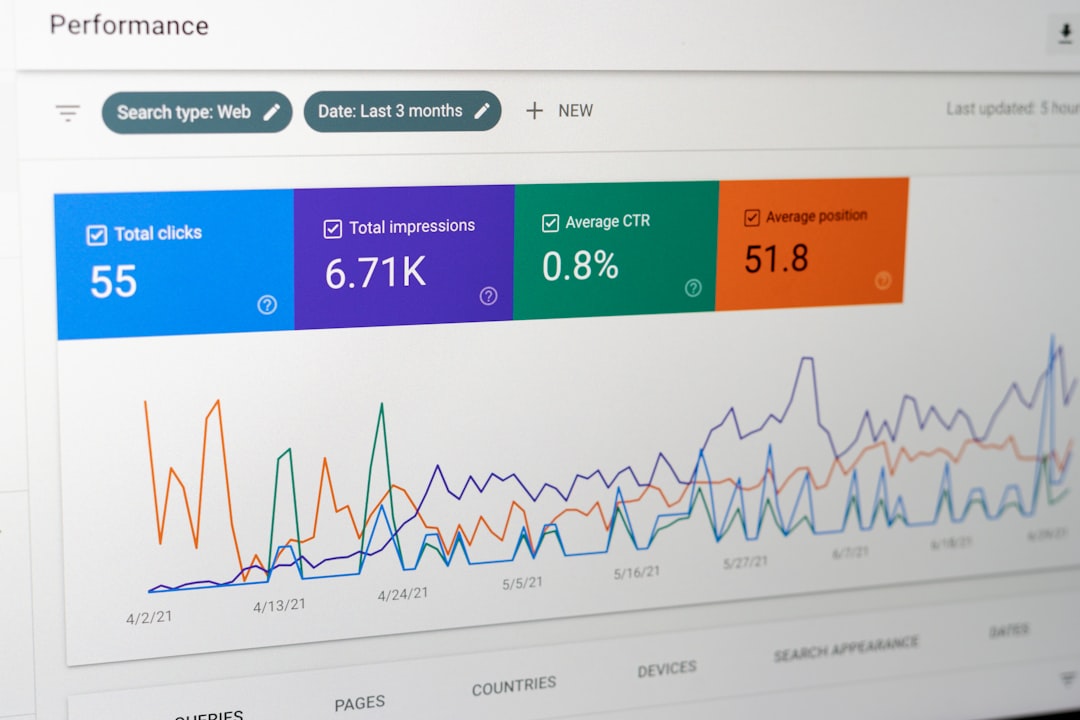
- Google Search Console (free): Criminally underused. The ‘Queries’ report shows you what you’re already ranking for but not optimizing. I’ve found dozens of page-2 keywords in client accounts that needed just a minor content update to hit page 1.
- AnswerThePublic / AlsoAsked: Perfect for finding question-based keywords and building FAQ sections that capture featured snippets.
- Keyword Surfer (free Chrome extension): Lightweight, shows volume and related terms right in Google search results. Great for quick research on the fly.
A word of caution: don’t try to use all of these at once. Tool overload leads to analysis paralysis. Pick one paid tool and supplement with Google Search Console. That’s honestly enough to start.

Search Intent Is the Variable Most People Skip
I want to spend a moment on this because it’s the most common mistake I see even from experienced content writers. Search intent breaks down into four types — informational (‘how does X work’), navigational (‘brand X login’), commercial (‘best X for Y’), and transactional (‘buy X online’). Writing the wrong content type for a keyword’s dominant intent will tank your rankings regardless of how well-optimized the rest of your page is.
Real example: a client was targeting the keyword ‘project management software’ with a detailed 3,000-word educational blog post about the history of project management. Traffic? Nearly zero. Why? The SERP for that keyword is dominated by listicles and comparison pages — commercial intent. The moment we rewrote it as ‘Top 10 Project Management Tools Compared,’ the page started gaining traction within 8 weeks.
Before you write a single word, Google your target keyword and look at what’s already ranking. The format and intent of the top 5 results is Google telling you exactly what it wants to serve for that query.
The ‘Keyword Cannibalization’ Problem Nobody Talks About Enough
Here’s a scenario that trips up a lot of bloggers who’ve been publishing for a while: you write five articles all loosely targeting similar keywords. Instead of one strong page ranking, you now have five weak pages competing against each other. Google sees them all as equally relevant and spreads authority thin across all of them — so none rank well.
This is keyword cannibalization, and it’s more common than you’d think. The fix? Audit your existing content using a site crawl tool (Screaming Frog has a free version that works for up to 500 URLs), identify overlapping keyword targets, and either consolidate similar posts into one authoritative piece or clearly differentiate their angles.
After doing this consolidation exercise for my own blog — merging 4 mid-performing posts into 1 comprehensive guide — the resulting page ranked in the top 5 for its target keyword within 12 weeks. The traffic from that single page now exceeds what all four original posts were generating combined.
A Realistic Timeline: What to Actually Expect
One more thing worth saying plainly: keyword research is the planning phase. It doesn’t produce results by itself. And even with perfect execution, organic SEO takes time. Here’s a rough benchmark framework based on domain authority:
- New site (DA 0–20): Expect 6–12 months before meaningful traffic from organic search. Focus entirely on long-tail, low-competition keywords (KD under 20 in Ahrefs).
- Mid-authority site (DA 20–40): You can start targeting Tier 2 keywords. Realistic timeframe for a new post to rank is 3–6 months.
- Established site (DA 40+): You now have the authority to go after Tier 1 terms, though competitive keywords still require significant content depth and link support.
These aren’t guarantees — they’re calibration tools. Use them to set realistic expectations with clients, bosses, or yourself, so you don’t abandon a strategy that just needs more time.
If there’s one thing to take away from all this, it’s that keyword research in 2025 is less about finding the ‘right’ words and more about understanding the right conversations your audience is already having. Stop chasing volume. Start chasing intent.
What do you think — are you still building around individual keywords, or have you already made the shift to topical clusters? Drop your experience in the comments, I genuinely read every one.
📚 관련된 다른 글도 읽어 보세요
- 주식 유튜버 다 틀렸다 — 2026년 지금 당장 사야 할 미국 배당주 TOP 3 (feat. 실패 시나리오 포함)
- 이것만 알면 나도 할 수 있다 — 2026년 기준 미국 주식 처음 시작하는 법 완전 정복
- 2026년 가성비 쩌는 싱글몰트 위스키 Top3 — 10만 원대로 이걸 마실 수 있다고?
태그: keyword research, SEO strategy 2025, topical authority, search intent, long-tail keywords, content marketing, SEO tools